Customizing the Plot View
Plot View tab (View Options dialog)
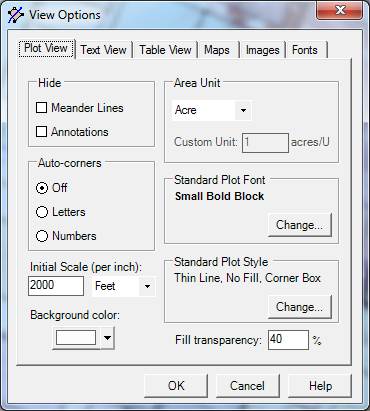
To see this dialog, open the View menu and select Options. Click on the Plot View tab. A number of characteristics of the Plot View can be set, and we encourage you to try experimenting with various combinations.
Hide Meander Lines - When checked, this box causes meander lines (lines described with the Lm code in the deed text) to not be shown. Disabling the meander line display can make for more attractive deed maps in certain cases. This option only has effect if you have deeds that use the meander code.
Hide Plot Annotations - When checked, this box causes any annotations attached to plots to not be displayed. This option only has effect if you have one or more plots with annotations.
Auto-corners - Corner descriptions can be automatically numbered or lettered when they are displayed by the Display menu. Numbering or lettering can provide a more attractive presentation of information and can help in understanding whether the survey runs clockwise or counter-clockwise.
Initial Scale - The initial scale setting is used by DeedMapper at startup. It is also used by the Navigate Jump command. The standard scale is 2000 feet per inch which means that printouts done at that scale will be compatible with U.S.G.S. topographic maps. Change this value if you want your printouts to match the scale of maps other than topographic maps.
Background color - Press the small down arrow to make an array of colors available. The color you choose will become the background color of the Plot View. The background color is used both on the computer screen and on printouts.
Area Unit - When the Display menu is set to display the actual area of the selected parcel it displays the value in terms of the unit chosen here. You can choose from a number of area units, with acres being the most commonly encountered one. If you choose Custom Unit in the dropdown list, you can then fill in the number of acres considered to represent one custom unit. For example, if you wanted to measure area in terms of roods (an old unit equal to 1/4 acre) you’d select Custom Unit and then enter .25 acres.
Standard Plot Font - Pressing this button will bring up the Font dialog box. It allows you to choose the standard font used by the Display menu commands. The standard font is the one that all deeds normally use; however, you can select one or more deeds and set their font to a custom value by using the Edit Font command. This option only has effect when a Display command has been selected. To change the color of the text, press the Standard Plot Style button (see next).
Standard Plot Style - Pressing this button will bring up the Plot Style dialog box. It allows you to choose the standard style used to plot deeds. Customization of plotting style is allowed by selecting one or more parcels and using the Edit Plot Style command. Generally speaking, changing the standard plot style will have an immediate effect on all of the parcels being displayed. You can select line thickness, color fill, line color, text color, and other aspects of display.
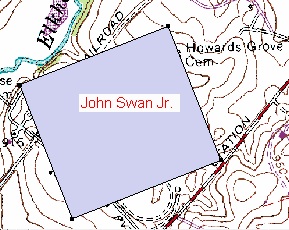
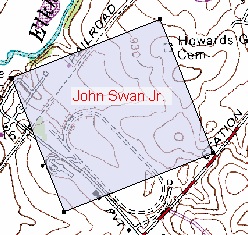
Fill transparency – Enter a number between 0 and 100 to set the transparency of parcel fill coloring (see the previous paragraph) and Display menu text. A value of 0% means that parcels will be filled with solid colors, and a value of 100% essentially disables parcel fills. This feature is most useful when you are using background images such as topographic maps. The examples below show transparency values of 0% and 40%. Note that depending on your computer’s speed you may notice a slowdown of Plot View display when using this feature with large numbers of filled parcels.